At EA, our endeavours in Strategy and Architecture Consulting, Learning and Recruitment give us unique insights into many aspects of the professional landscape for architects within Australia. We thought we would take this opportunity to share some of the trends and changes that we witnessed in the Australian marketplace in the last financial year.
This inaugural report reflects on a time when we saw a number of shifts and changes in the marketplace: the slowdown of the commodity boom; a new Federal Government finding their feet; lower interest rates; a falling dollar and a strong push towards customer value creation to name a few. There’s no doubt that these factors have had an impact on the demand for strategy and architecture professionals in the last financial year. In this report we will highlight some of these trends, examine the drivers of change and try to understand any associated implications.
Click here to download the infographic
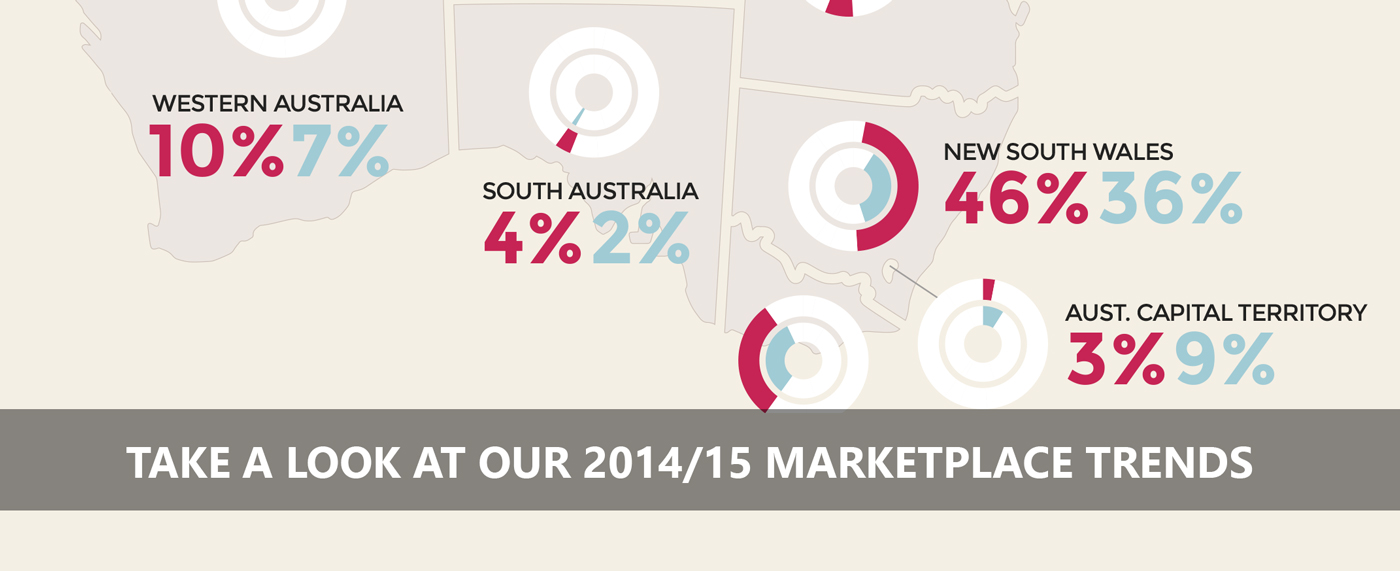
The highest levels of demand for architecture talent came, as you would expect, predominantly from NSW and VIC. It is interesting, however, when you start to look at the supply side (the number of candidates applying for jobs). In NSW, WA and SA we experienced an oversupply of talent in relation to demand. Conversely, in VIC, QLD and ACT there was a shortfall. The lack of supply however was most apparent in ACT and QLD where it fell significantly short of demand. In ACT this can be attributed to a new government with a renewed focus on security and border protection as a result a number of big programs beginning to mobilise across Customs and Immigration, AFP and DoD. In QLD the lack of supply seemed to stem from lack of movement in the job market where we noticed a drop in confidence, and as a result, a reluctance for employees to explore new opportunities and leave current roles.
We predict these in-balances in the marketplace should drive greater levels of commuting and relocation into ACT and QLD this year. In fact, late in the financial year, we noticed a stronger number of WA-based architects willing to commute and work outside the state.
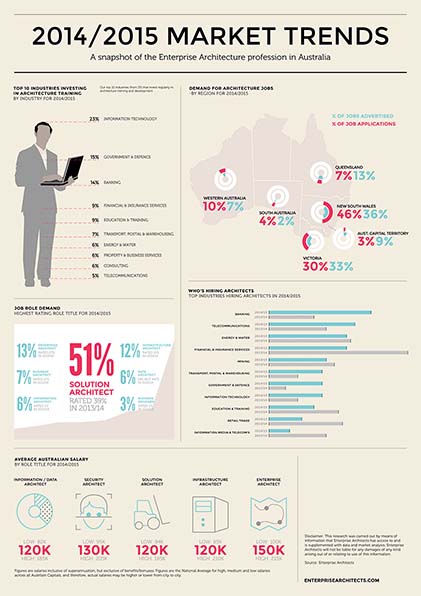
Which industries were hiring?
In 2013/14 Financial Services, Energy and Mining sectors made up a large proportion of demand. However, in 2014/15 we experienced a shift to Banking and Telecommunications. It is also important to note that this was accompanied by substantial growth in the IT and Government sectors as well.
This increased demand within the banking and telecommunication sector seems to be coming from a focus on strategies that deliver customer value and thus driving the need for know-how across the three disciplines of information management, service design and business architecture.
Who invested in architecture training?
The IT industry was a stand out when it came to architecture training in 2014/15. We saw 23% of architecture training stem from IT organisations while 15% was solicited by Government and 14% by Banking.
The high investment in training within the IT sector is another indicator of further maturity within the architecture industry with many global vendors keen to adopt TOGAF as their standard architecture framework. The need to have a standardised method that aligns to their clients and in particular the desire to speak a common language is driving this investment.
What were the hottest roles?
Solution Architecture featured as it does every year as the most prolific role within the architecture job family. However, there are some new roles emerging and becoming more and more prevalent. In particular, we noticed the Business Designer role start to emerge within the Business Architecture job family in 2013/14 and by the end of 2014 there was a definite demand for this role. We predict this demand will continue to grow and develop across industries in 2015/16.
We also experienced a growth in demand for Information Architects and Data Architects. We have seen this trend continue to grow in the latter quarter of 2014/15 as many of our clients strive to develop and implement Information Management strategies.
What’s happening with Remuneration?
The remuneration data in the infographic has been provided by an independent nationwide survey and includes regional Australia. In our experience, as we only operate in the major cities, we feel the upper levels quoted in the infographic are more representative of the packages we’ve seen offered in 2014/15.
We’ve also noticed a rise in average salary levels in when compared to our data in 2013/14. The main factor influencing this trend has been that a number of clients made the decision to build formal practices over 2014/15 and brought in a layer of enterprise management level professionals to help build and run architecture organisations. In many cases the managers have been aligned across the EA stack Business, Applications, Information and Technology Architecture. This represents a big vote of confidence in the discipline and should foreshadow a rise in transformation and demand for solution architecture in the coming 12 months.
In summary the architecture profession is still a very healthy professional marketplace in Australia. The market for talent remains strong with definite new opportunities to plan future careers. These trends and others have been represented in the infographic below. This infographic is free to download and has been made to print, so why not share it with your colleagues or put it up in the office?
Have you noticed any other trends in the architecture community? We would love to hear your thoughts below.